Rfeet Help Guide
Introduction
Rfeet is developed to visualise Ribo-seq and RNA-seq read density profiles. The profiles for multiple genes can be generated at the same time using either absolute or normalized read counts. Read density profiles are generated using the 5’ coordinates of the mapped reads, generating coverage plots for RNA-seq footprints. The pauses predicted by "PausePred" can be visually explored using Rfeet.Inputs:
1. First alignment file:
A sorted BAM file can be generated by using the SAMtools sort option(Li et al., 2009). For users not familiar with command line tools, a BAM alignment file can be generated and sorted in RiboGalaxy (http://ribogalaxy.ucc.ie). The filename should have a .bam extension. Also, please avoid spaces or special characters like '(' in the file name. Thefile can be easily browsed from your computer by clicking on choose file option.For example:
example1_genome.bam is correct.
example1_genome(1).bam is incorrect.
1.1 Input1 name:
The name will be used for the plot legend. The default value is ribo-seq which can be changed to the name you want to appear in the legend of the plot.
2. Second alignment file:
The second alignment file is optional. It can be an RNA-seq alignment file or another Ribo-seq alignment file to use for comparison with first RiboSeq BAM file. The file name should have .bam extension. Also, please avoid spaces or special characters like '(' in the file name. The file can be easily browsed from your computer by clicking on the 'choose file' option.2.1 Input2 name:
The name will be used for the plot legend. The default value is rna-seq which can be changed to the name you want to appear in the legend of the plot.2.1 Coverage plot:
The second file can be plotted as a coverage plot, where the number of sequence reads aligning to each coordinate are displayed in this case, the second file is plotted as a background plot.3. Reference FASTA file:
The reference sequence (genomic or transcriptomic) in a FASTA format which was used to generate the BAM file should be uploaded here. Please avoid spaces or special characters like '(' in the file name.For example:
example_genome.fa is correct.
example_genome(1).fa is incorrect.
4. Gene/Transcript/Chr:start-stop:
The gene/transcript name should be entered if you want a footprint density plot of the full length gene/transcript using a transcriptome alignment .bam file. If you want to plots genomic regions using genomic alignments, the input format should be chr:start-end where 'start' represents the starting coordinate of the plot and 'end' represents the end coordinate of the plot. For example chr:3347-4347.Multiple genes/transcripts or chr locations can be plotted at the same time using a comma separated list. Example given below
##For transcripts: NM_006088.5,NM_015456.4,NM_053045.1
##For genomic coordinates: chr:3347-4347,chr:2347-3346,chr:4348-5347
##For genes: PHPT1,RABL6,MAMDC4
Note:
Please make sure the same Gene/transcript or chromosome name is present in reference FASTA header. For example if you want to plot transcript 'NM_001135861.2', the reference file FASTA header should be something like as follows:>NM_001135861.2
CTCCTTGTACCGGTAGCGGGGTTGGGGACGGAAGCCTTCGGTCGGTGGAGAGGAGAAAGGGAGAGGCCTT CGGGCGGTGGACGGGGAAGAGAGGGAGTCCTTCGGGCGGTGGAGGGGGTGGAGAGCGAGGCCTTCGGGCG
or this maybe
>NM_001135861.2 Homo sapiens phosphohistidine phosphatase 1 (PHPT1), transcript variant 2, mRNA
CTCCTTGTACCGGTAGCGGGGTTGGGGACGGAAGCCTTCGGTCGGTGGAGAGGAGAAAGGGAGAGGCCTT CGGGCGGTGGACGGGGAAGAGAGGGAGTCCTTCGGGCGGTGGAGGGGGTGGAGAGCGAGGCCTTCGGGCG
5. Offset value:
An offset value can be used to infer the location of the A-site. Use a positive value to add an offset to the 5' read end, whereas a 3' offset should be specified with a negative number. The position of the A-site is inferred using the following calculations:##for 5'offset
Infered A-site= Read position + offset_value
##for 3'offset
Infered A-site=(Read position+read length-1)-offset value
6. Plot type:
The plot type provides an option to plot either the raw read counts or normalized read counts.6.1. Absolute:
This plot type will use raw counts of mapped reads from the input alignment file(s). The number of reads mapped on each location will be provided in the output CSV file.6.2. Normalized:
The 'normalized plot' is generated by dividing the number of reads mapped on each position by the total number of reads mapped in a particular profile.
7. E-mail address:
The link to the result files will be emailed to you. Please input a valid email id such as abc@domain.com.Output:
The Rfeet plots will be generated on our server and once the process is completed a mail is sent to the user with a hyperlink to the output file. The output zip file contains plots in PNG format accompanied by the read counts in CSV files.
Example plot generated using transcriptome alignments
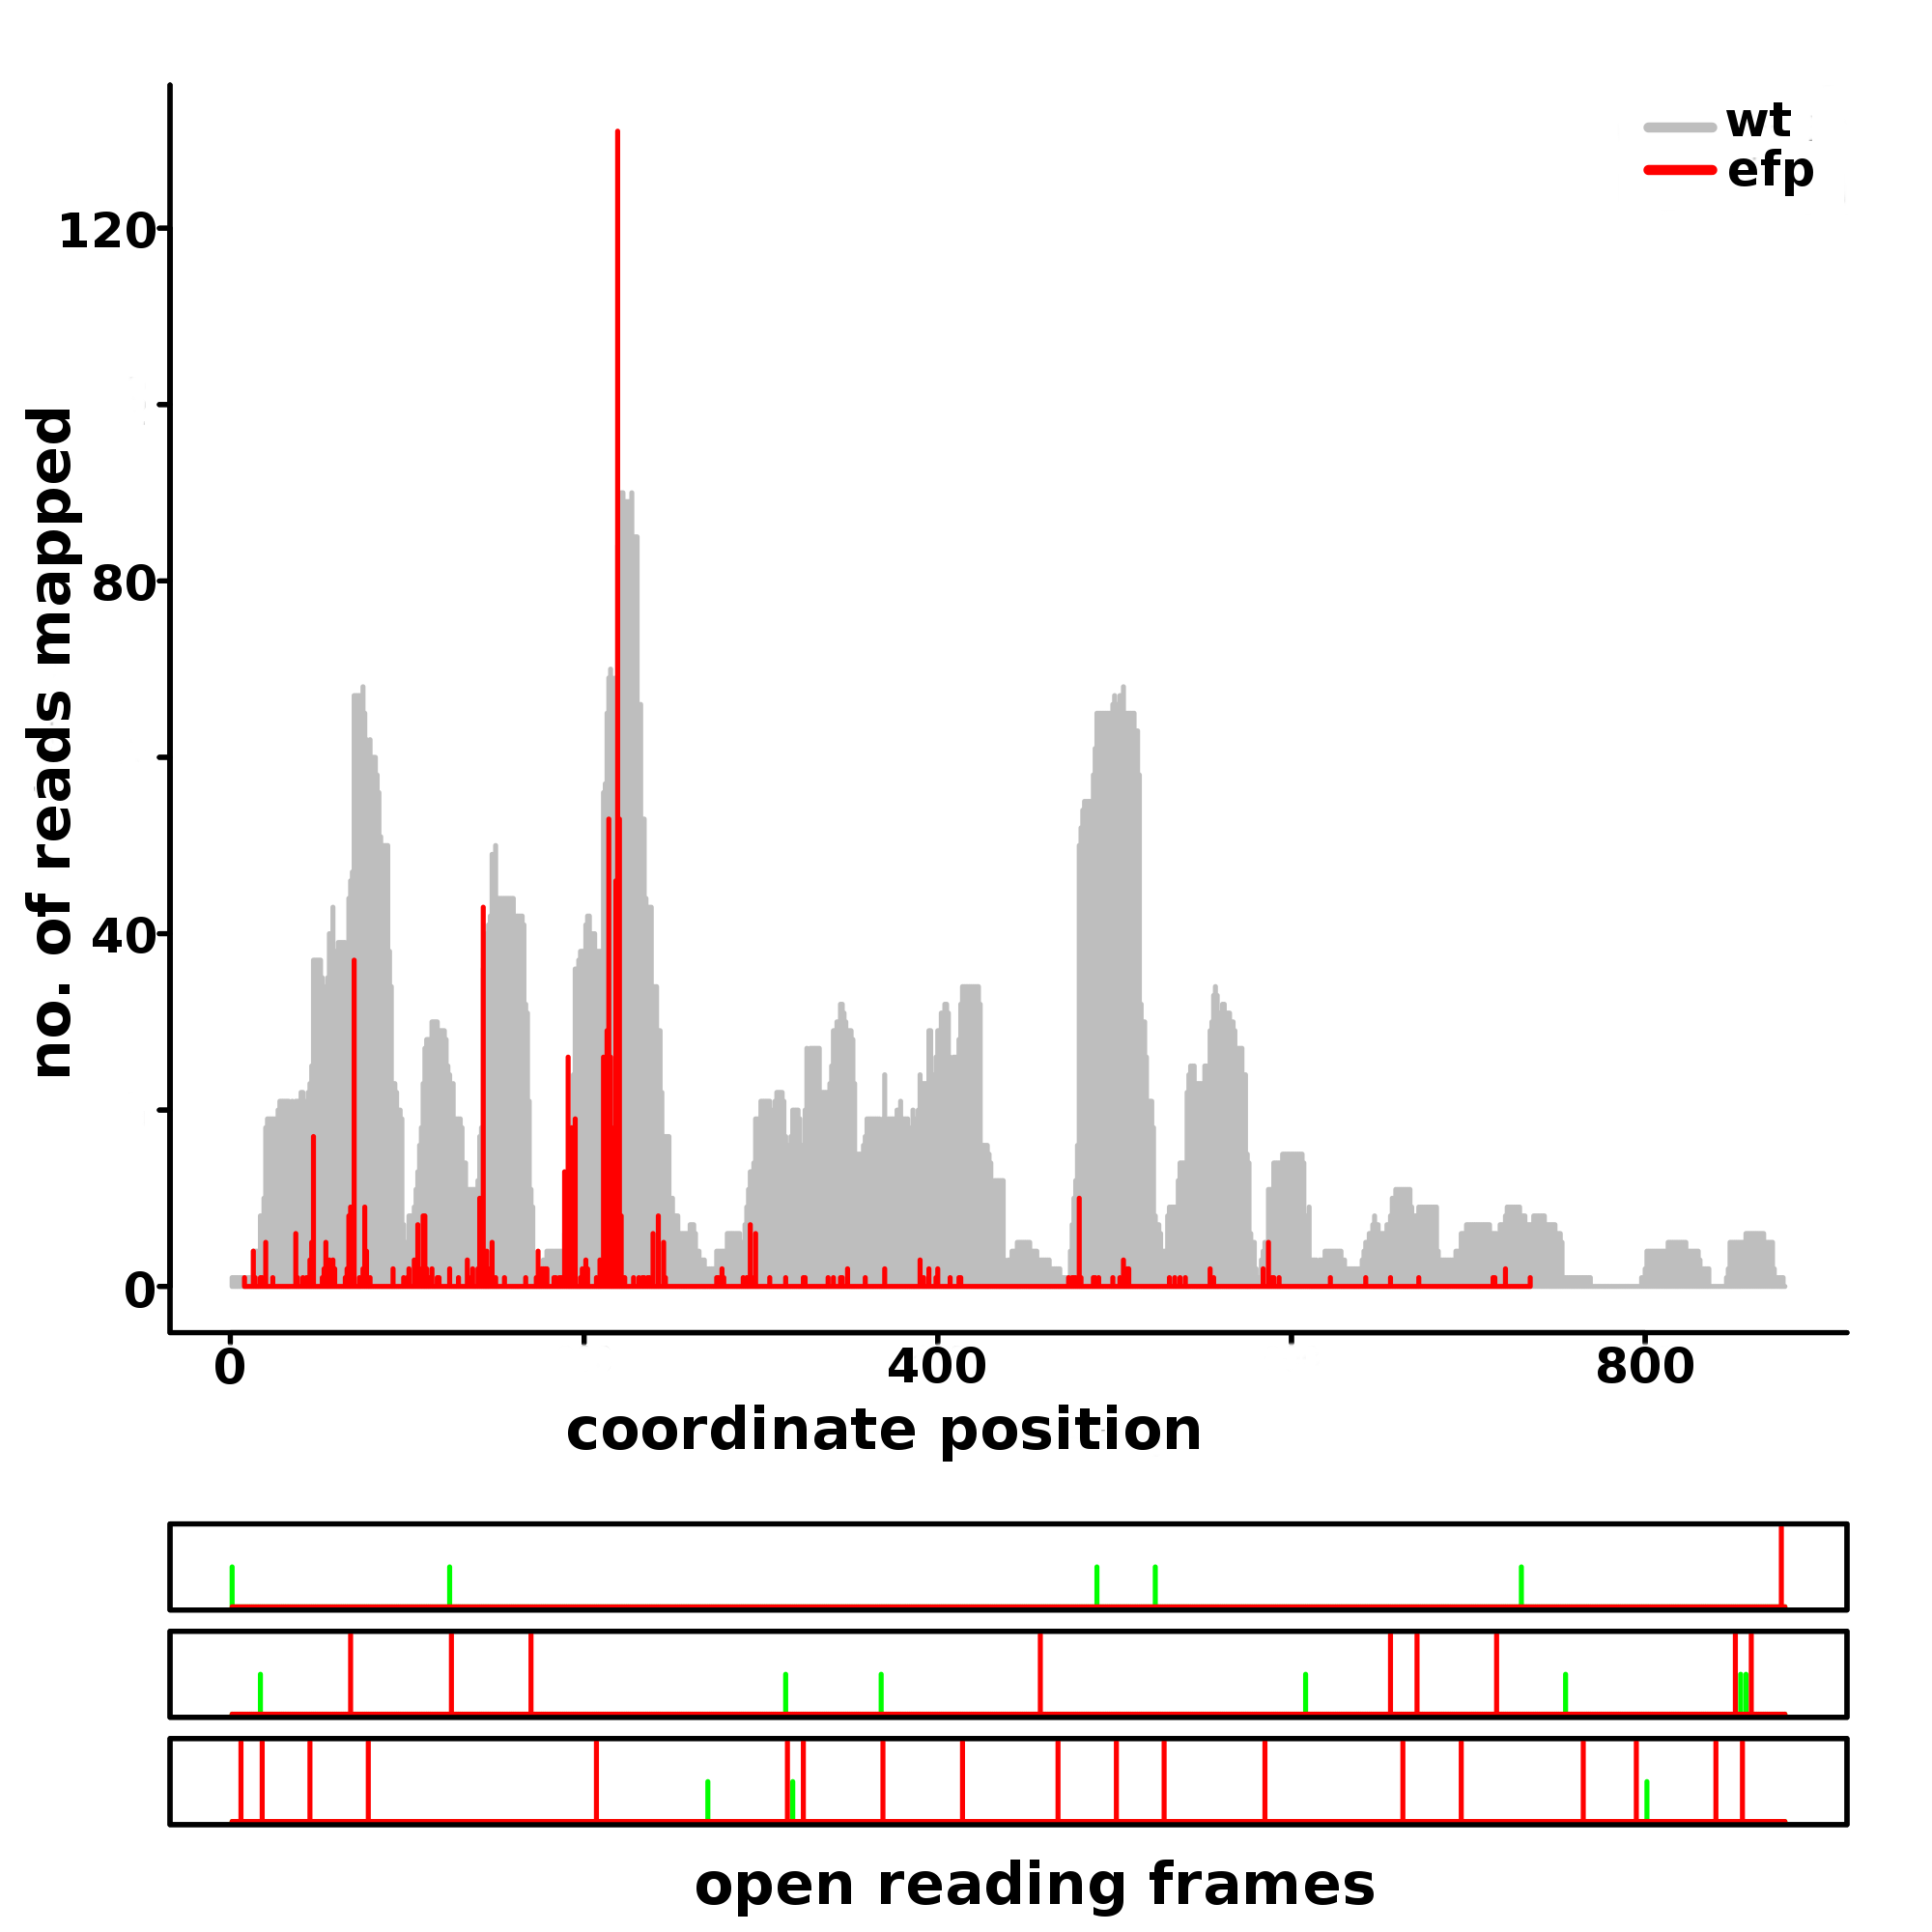
Rfeet ribosome density profile of the E.coli gene araC showing a ribosomal stall detected by PausePred at position 214 with a pause score 96.16 using RiboSeq data generated in E.coli mutants lacking elongation factor EFP (red profile).The background grey coverage plot represents RiboSeq data generated for the wild-type strain. Both RiboSeq datasets are from (Woolstenhulme et al., 2015).
Example plot generated using genome alignments

The ribosome density profiles of the E.coli gene clpA (alignments in the forward direction in red) and the infA gene (reverse direction in blue) produced using Ribo-seq data generated in E.coli mutants lacking the elongation factor EFP (Woolstenhulme et al., 2015). Footprints for the wild-type sample are shown as a gray coverage plot in the background.
How long will it take to process my job?
The total time taken for processing your data depends on various things, such as:1. Size of input file:
Large input files will take longer to upload and process.2. Internet speed on your system:
Your internet connection speed will affect the time taken to upload your files.3. Number of users running Rfeet simultaneously:
The number of people using Rfeet simultaneously may affect the processing time.4. Number of genes being plotted:
The time taken will be related to the number of genes being plotted.*We have tested the tool with different file sizes(one gene at a time) and approximate time Rfeet took to process the data is given below:
~1GB->10-15 mins
~2GB->30-45 mins
~4GB->2-2.5 hours
Important links:
Stand-alone version
The stand-alone version of Rfeet can be downloaded from the github link provided on the Rfeet website (highlighted point 8 in the Rfeet screenshot image)